
Degree Analytics has conducted a comprehensive meta-analysis encompassing a student population exceeding 100,000. The selected institutions for this study present a varied landscape, ranging from rural to suburban settings. They differ in size — from a few thousand to tens of thousands of students — and type, including both public and private entities. Furthermore, these institutions are characterized by a wide range of demographic profiles, providing a rich and varied dataset for analysis.
Data Integrity and Privacy: The integrity of our analysis is underpinned by stringent data management practices. All data utilized has been meticulously de-identified and anonymized, ensuring the utmost privacy and confidentiality.
Disclaimers:
-
Trend Analysis: Predominant trend lines have been identified and analyzed individually across most of the institutions. It is important to note, however, that trends can vary significantly at individual institutions.
-
Contextual Variability: The findings of this analysis are influenced by the specific contexts of the participating institutions. Hence, direct applicability to other institutions should be considered with caution.
-
Degree Analytics's Student Engagement Score: This score is a proprietary calculation by Degree Analytics. It encompasses both the physical and virtual use of the campus. Data that is not present in this analysis that is included in the overall Student Engagement Score include sources such as the Learning Management Systems and Video Conferencing Systems.
-
Overlapping Behavioral Times: The data presents a multifaceted view of student engagement across various campus spaces, accounting for the possibility of overlapping activities within shared environments. For instance, the library, traditionally a place for study, may also serve as a social hub, where the time spent could simultaneously contribute to 'Library Usage' and 'Social Time' metrics. While categorization methodologies remain largely consistent across the spectrum of institutions involved in this study, individual campus policies and student habits may lead to slight variations in how these activities are recorded. It is crucial to consider this overlap to appreciate the full context of student behavior and the potential multifunctionality of campus spaces.
-
Scope of Data Limitation: It's essential to clarify that the scope of the analysis is confined to time spent utilizing on-campus resources. The data collected does not extend to activities pursued off-campus, which means that any student engagement or behaviors occurring beyond the bounds of the institution's facilities are not captured within this dataset. This limitation is noteworthy, as off-campus student activities contribute significantly to the overall student experience and learning outcomes, albeit not represented in this particular analysis.
-
Behavioral Spaces and Actual Use: The collected data aims to approximate student behavior based on the presumed use of various campus spaces designated for specific activities. However, it is acknowledged that the actual use may not always align perfectly with the intended use. For example, while a cafeteria is designated as a dining space, students may utilize it for studying, which would be documented as 'Dining Time' rather than 'Study Time.' Such instances highlight that while there is a high correlation between the nature of a space and its primary use, the diverse ways students may utilize these spaces can blur the lines between different behavioral categories.
Overview
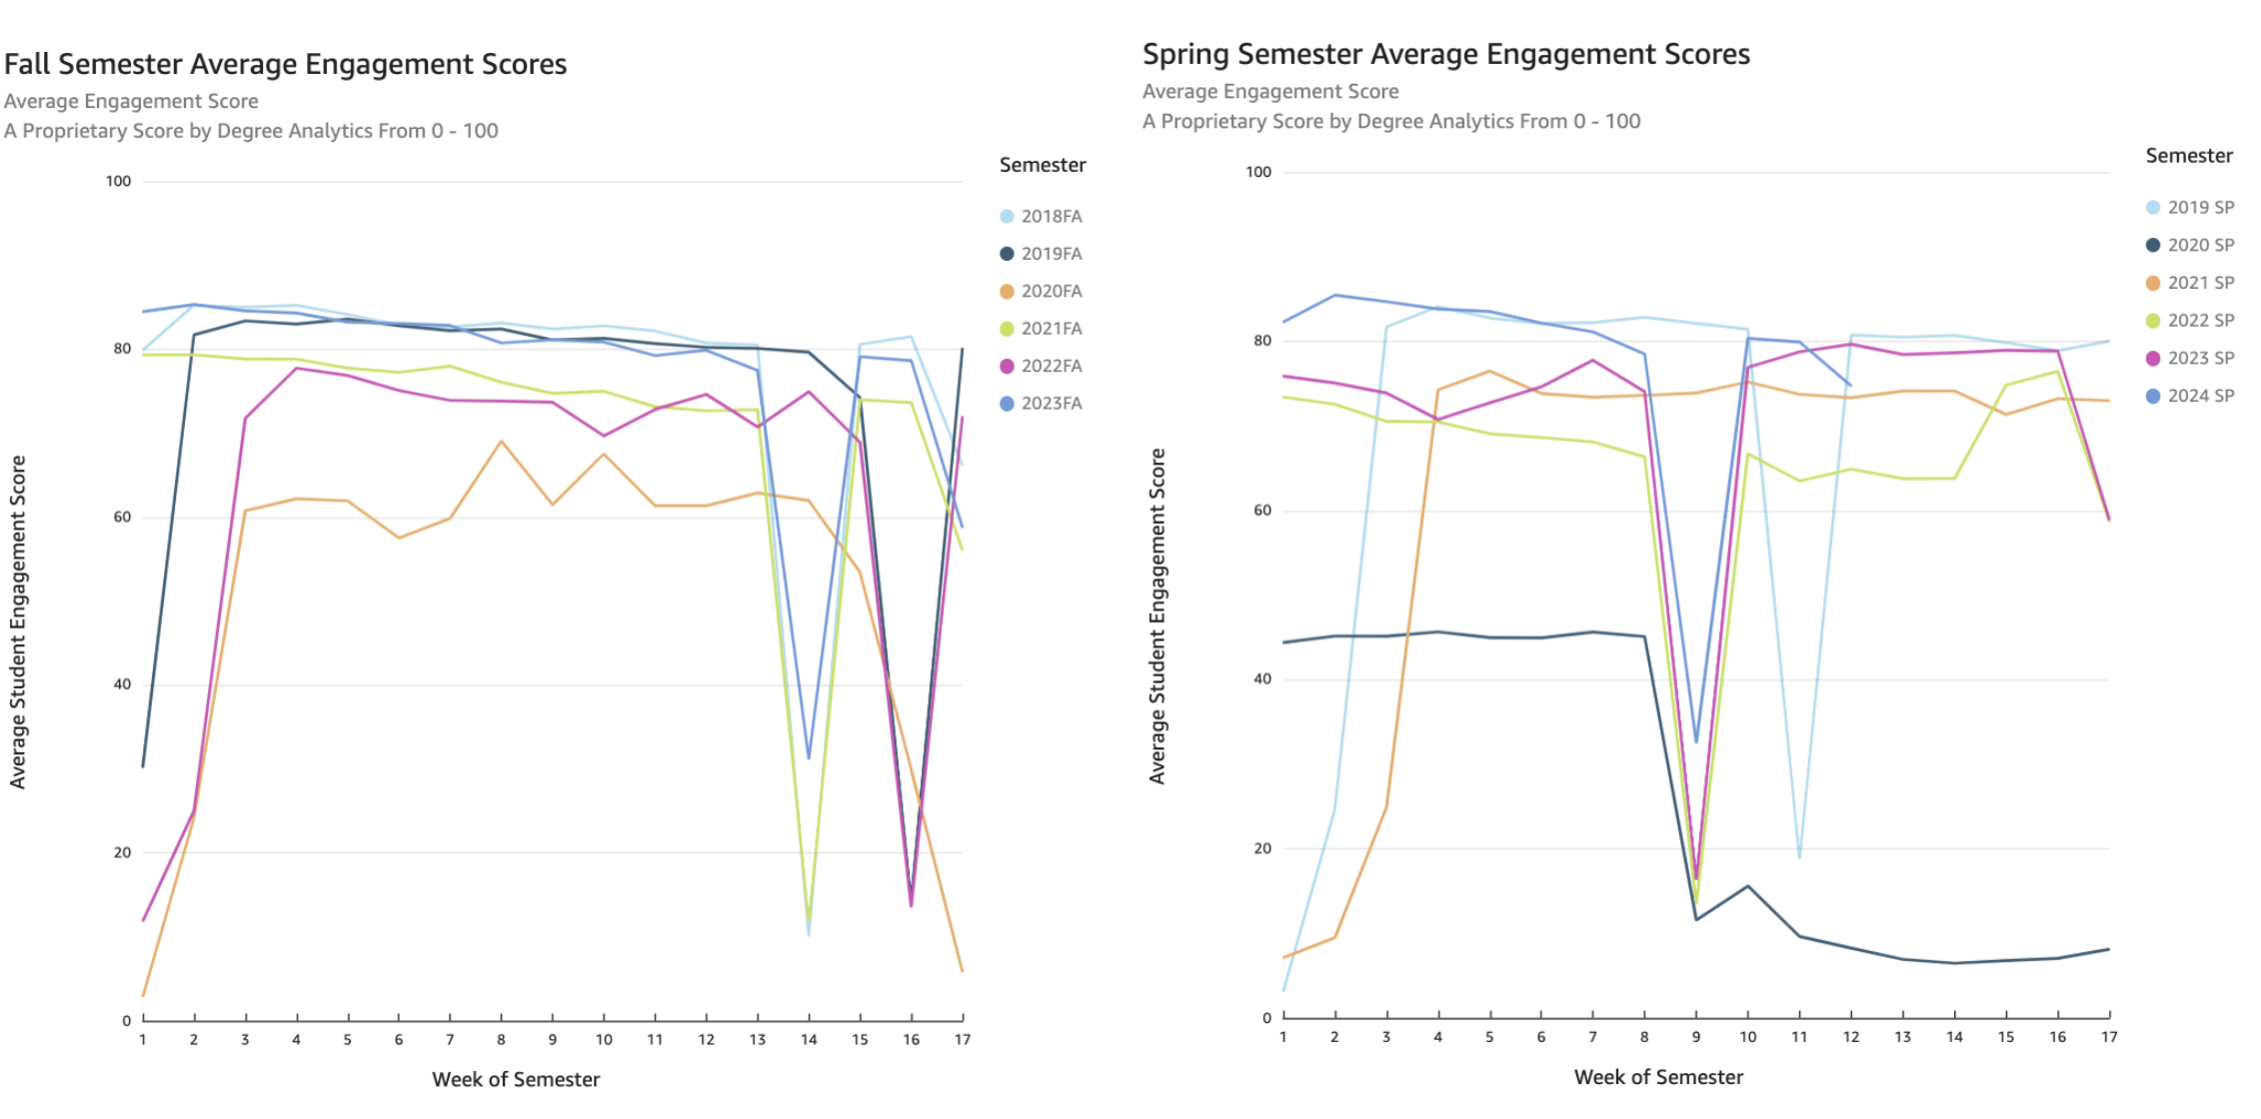
This image shows the Student Engagement Score attributed to students each week of the semester, comparing both Spring and Fall Semesters accordingly. For example, in week 9 in the Spring semester, the consistent drop year-over-year represents Spring break.
Student engagement experienced a notable contraction during the onset of Covid, as evidenced in the Spring and Fall semesters of 2020. This trend, marked by a general retrenchment in engagement, has since exhibited a gradual resurgence, edging closer to pre-pandemic levels with each passing year. However, the rebound is not uniform across all activities. Noteworthy is the divergent trajectory of socially-oriented behaviors—while activities like Dining and Fitness witnessed declines, others saw increases. A significant driver behind the reduction in campus presence, particularly in academic spaces, appears to be the proliferation of hybrid educational models, which align with a rise in Learning Management Systems (LMS) usage and remote learning opportunities.
The dataset uncovers a nuanced tapestry of behavioral adjustments among students, underscored by variations in engagement intensity. Those in the lower percentiles demonstrate a pronounced withdrawal from social facets of college life, a shift likely exacerbated by pre-existing lower levels of engagement prior to the pandemic. In contrast, students with higher engagement metrics have navigated the transition with remarkable adaptability, embracing alternative learning modalities and increasing their participation rates. These contrasting responses serve as critical indicators for educational institutions, offering actionable data to recalibrate support mechanisms and foster inclusivity within the evolving educational landscape.
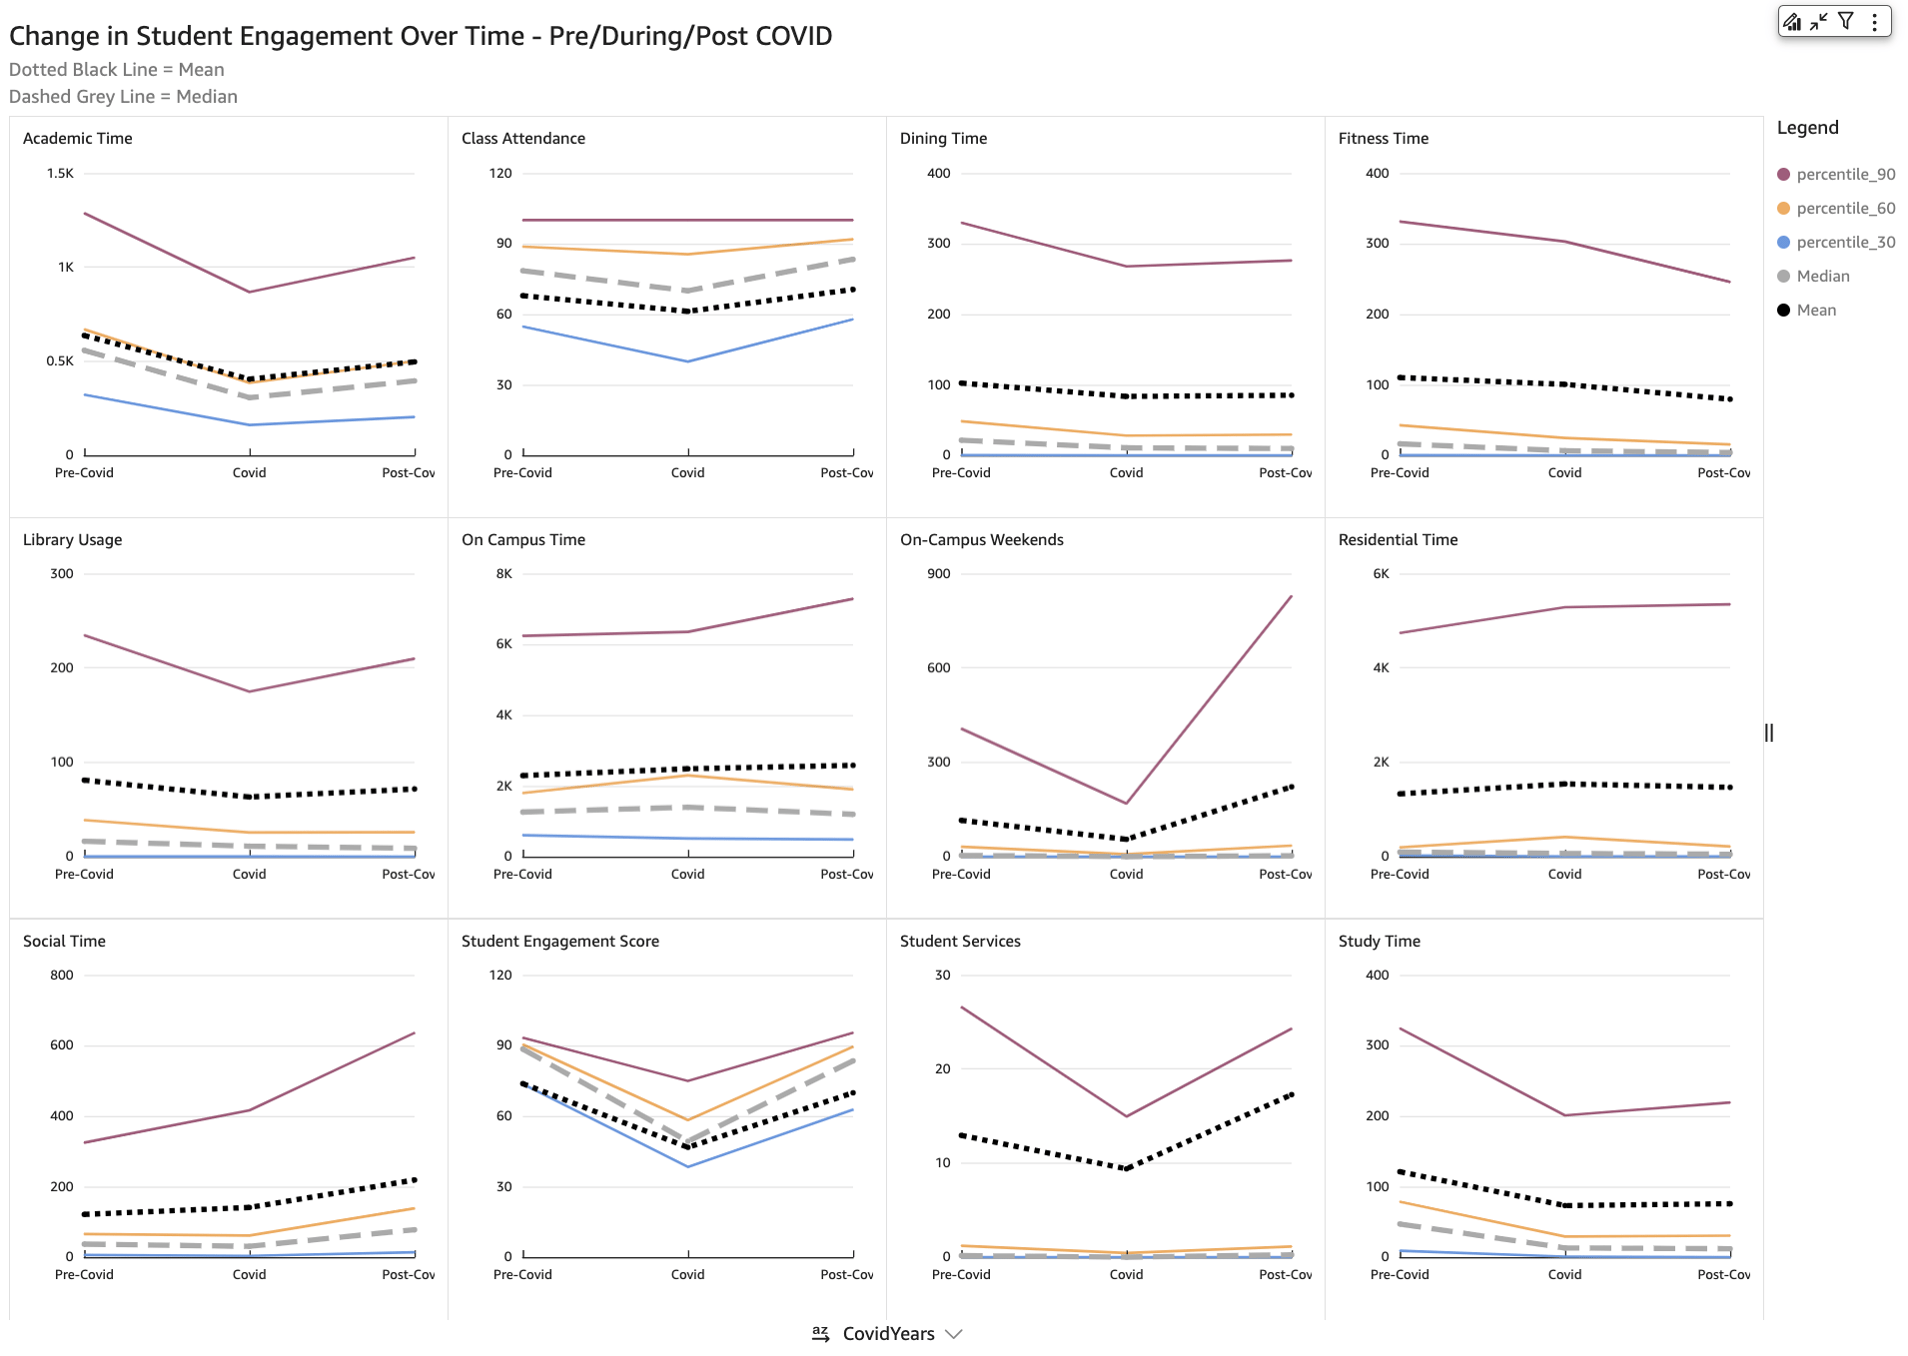
This image shows the different percentiles and average time of overall engagement by space type. The X-Axis groups years previous to 2020 as "Pre-Covid". Due to different institutions reopening their institutions on different semesters, the "Covid" years can begin in Spring of 2020 and end Fall 2020 or Spring 2021 depending on the institution's policies. "Post-Covid" years are aggregated years thereafter. Each Y-Axis is adaptive in scale according to the space type and usage.
Key Findings
1. Academic Time: Post-Covid, academic time reduced by -22.01% on average, with a particularly steep decrease at the 30th percentile (-36.75%). This suggests that lower-engagement students significantly cut down their on-campus academic presence.
2. Class Attendance: Contrastingly, class attendance exhibited resilience, with the mean percentage increasing slightly by 3.89%. Notably, the increase in the lower percentiles (5.68% in the 30th percentile) suggests that greater accessibility has led to better attendance, possibly due to the convenience of online and hybrid formats.
3. On-Campus Time: The mean time spent on-campus during weekends surged post-Covid by 92.57%, with the overall average on-campus time increasing by 12.66%. This indicates a change in weekend campus dynamics, possibly reflecting a shift in when students are engaging with campus resources. For some students, namely those that appear to be residential, the increase in the top percentiles suggests that these students are spending more time in their residence halls, as opposed to being socially engaged across campus.
4. Social Time: The average social time escalated by 80.53%, highlighting a post-Covid rebound in social activities among the most socially active students. Its worth noting that the 50th percentile of students saw an average increase of approximately 40 additional minutes per week, which is more than double previous activities. The increase at the top is more profound, accounting for an additional 6 hours of social time in the 90th percentile.
5. Library Usage: The average library usage saw an -11.50% decline, with a complete drop at the 30th percentile (-100.00%). This sharp falloff indicates a major shift in social study habits, potentially toward digital resources or other locations.
6. Fitness Time: There was a drastic average decrease in fitness time (-27.84%), hitting the 30th percentile hardest with a -100.00% decline, which may suggest a permanent change in physical wellness activities, or that students are seeking other independent fitness opportunities outside of campus facilities.
7. Residential Time: The average duration of student presence in residential spaces has risen by 10.40%, with those at the 90th percentile increasing their time by 12.81%. This suggests a heightened utilization of on-campus housing or a shift toward more students opting to reside on campus. Moreover, a discernible shift appears among the 30th percentile— representative of commuter or off-campus students—where an 82.90% decline in residential time points to adaptation in the wake of COVID-19 dormitory restrictions. This substantial drop hints at the emergence of alternative social hubs, potentially correlating with the notable 130.25% surge in social space usage, indicating a pivot to off-campus congregations or other social venues.
8. Dining Time: Post-COVID dining time saw a mean decrease of -16.83%, but the 30th percentile faced a staggering -92.11% decline, reflecting a significant alteration in dining patterns, possibly due to a combination of safety concerns and new dining options. The large increase in to-go or pickup meals that was created or largely increased during COVID seems to have affected social eating patterns and opportunities.
9. Student Services: The usage of student services increased by 33.44% on average, with the 99th percentile notably rising by 77.75%. This pattern could indicate an enhanced dependency on support services in the wake of the pandemic's challenges. Namely, while most students use physically located student services less, the students who use these services frequently are using them much more than before, not less.
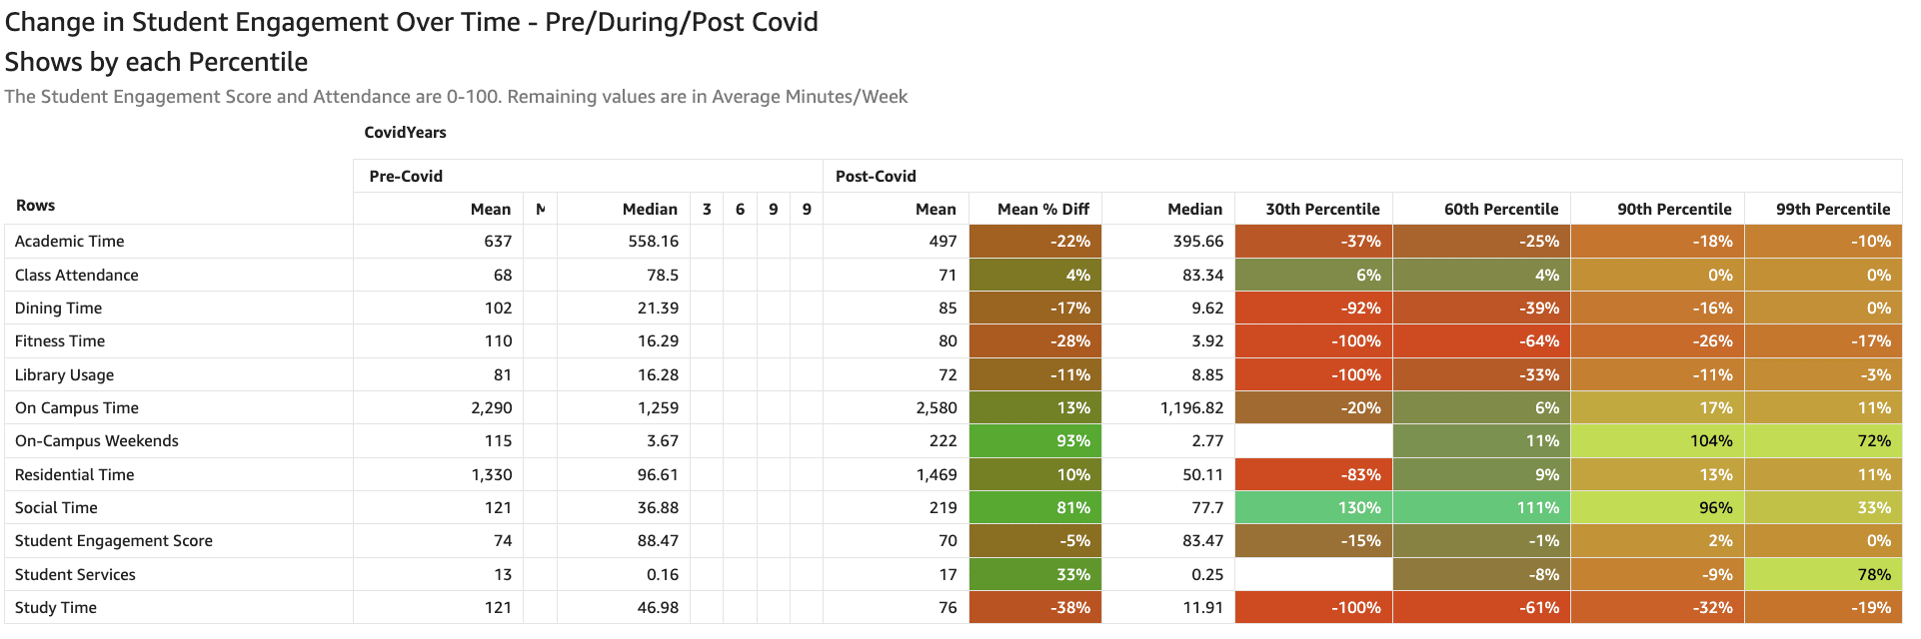
The above image provides a closer look at the comparative metrics across percentiles, as well as highlights the differences. Each row represents broader space categories. For example, for Total On-Campus Time, the total average amount of time spent on campus increased 13%, while the lower 30th Percentile decreased total time spent on campus by 20%, and the 90th Percentile increased 17% compared to Pre-COVID numbers.
For detailed insights or further inquiries regarding this analysis, please visit DegreeAnalytics.com


Submit a Comment
Your email address will not be published. Required fields are marked *